Generating Dynamic PDF Reports from Given Data: Report Cards

Introduction
It is useful to generate reports in PDF format so as they are not modifiable and can also be printed easily. Here we are going to talk about how to generate reports using UniPDF in the form of tabular data. We will be looking at it through an example of generating Individual report cards for students from a given set of data.
First we will be looking at generating data. Here we will be using structs and populating data manually, but we could easily provide the input data as an Excel XLSX file and use UniOffice to load the data. Perhaps we will add that in the future. Let us know if you are interested.
Then we will look at how UniPDF creates a table and how to insert cells and format the tables and how to insert the relevant data in the cells. After that we will write it all in PDF.
Generating Data
We can use structs to store the data. Here we have defined two structs. One struct to store the marks and subjects and another struct that holds the entire information for the students, like in our example name, marks (which is a struct) and conduct of the students.
type studentReportCardMark struct {
Subject string
Mark int
}

type studentReportCard struct {
Name string
Marks []studentReportCardMark
Punctual rune
Attentive rune
Orderly rune
Polite rune
}
We have made sample data for four students to generate our report cards. For example we will show one here.
var reportCards = []studentReportCard{
{
Name: "Mike",
Marks: []studentReportCardMark{
{
Subject: "Chemistry 101",
Mark: 21,
},
{
Subject: "Physics 101",
Mark: 13,
},
{
Subject: "English 101",
Mark: 50,
},
{
Subject: "Science 101",
Mark: 23,
},
{
Subject: "Biology 101",
Mark: 26,
},
{
Subject: "Computers 101",
Mark: 33,
},
{
Subject: "Tech 101",
Mark: 34,
},
{
Subject: "BioChem 101",
Mark: 14,
},
},
Punctual: 'C',
Attentive: 'B',
Orderly: 'B',
Polite: 'A',
}
}
Report Design
To design the entire report card we have used tables from UniPDF. For tables we have defined a map of cellStyles that holds the data for the different types of cells we wanna generate in our tables for this design. It has been implemented via struct that holds the properties for individual cells. This is pretty convenient and easy to add and change styles.
type cellStyle struct {
ColSpan int
HAlignment creator.CellHorizontalAlignment
BackgroundColor creator.Color
BorderSide creator.CellBorderSide
BorderStyle creator.CellBorderStyle
BorderWidth float64
BorderColor creator.Color
Indent float64
}
One such example of a cellStyle used in this design is used to write the heading to the left of the cell.
var cellStyles = map[string]cellStyle{
"heading-left": {
BackgroundColor: creator.ColorRGBFromHex("#332f3f"),
HAlignment: creator.CellHorizontalAlignmentLeft,
BorderColor: creator.ColorWhite,
BorderSide: creator.CellBorderSideAll,
BorderStyle: creator.CellBorderStyleSingle,
BorderWidth: 6,
}
Similarly the report card has used different cellStyles to generate the cells which are described below.
Header
For the header we have used a table of 1 cell with center aligned position and have used a rectangle to highlight the background of the Report Card Heading. It looks like this.

The code is as follows. And it also includes two lines at the end which were drawn using a newLine function.
// Filled rectangle on top.
rect := c.NewRectangle(0, 0, creator.PageSizeLetter[0], 120)
rect.SetFillColor(creator.ColorRGBFromHex("#dde4e5"))
rect.SetBorderWidth(0)
c.Draw(rect)

headerStyle := c.NewTextStyle()
headerStyle.FontSize = 50

// Table with 1 column to center the text.
table := c.NewTable(1)
table.SetMargins(0, 0, 20, 0)
drawCell(table, newPara(c, "Report Card", headerStyle), cellStyles["centered"])
c.Draw(table)

// Double line.
line := c.NewLine(0, 120, creator.PageSizeLetter[0], 120)
line.SetLineWidth(5)
c.Draw(line)

line = c.NewLine(0, 123, creator.PageSizeLetter[0], 123)
line.SetLineWidth(1.5)
c.Draw(line)
Generating a Student Description
Similarly using a 3 column table a description was generated for each student using the data that was added in the sample and some generic data for the rest of the columns.
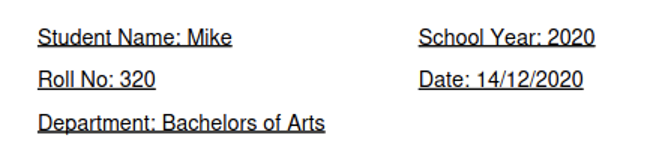
This was done using the drawCell function which was designed to draw individual cells as per our need in the given table.
drawCell(table, newPara(c, "Student Name: "+card.Name, studentInfoStyle), cellStyles["left"])

drawCell(table, newPara(c, "School Year: 2020", studentInfoStyle), cellStyles["left"])

drawCell(table, newPara(c, "Roll No: 320", studentInfoStyle), cellStyles["left"])

drawCell(table, newPara(c, "Date: 14/12/2020", studentInfoStyle), cellStyles["left"])

drawCell(table, newPara(c, "Department: Bachelors of Arts", studentInfoStyle), cellStyles["left"])
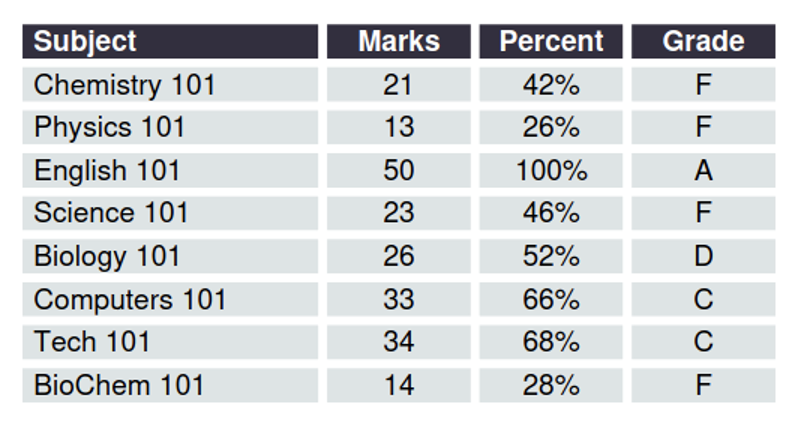
The Grade Table with Individual Subject Scores
The Grade Table was generated using the sample data and some functions were used to generate the grades and then add them to the table for individual subjects. The subject is left aligned and the rest of the columns are center aligned.
The code is as follows
for _, mark := range card.Marks {
drawCell(table, newPara(c, " "+mark.Subject, regularStyle), cellStyles["left-highlighted"])
s := mark.Mark
percent := (float64(s) / 50.0) \* 100.0
drawCell(table, newPara(c, fmt.Sprintf("%d", s), regularStyle), cellStyles["centered-highlighted"])
drawCell(table, newPara(c, fmt.Sprintf("%.0f%%", percent), regularStyle), cellStyles["centered-highlighted"])
drawCell(table, newPara(c, calcGrade(percent), regularStyle), cellStyles["centered-highlighted"])
}
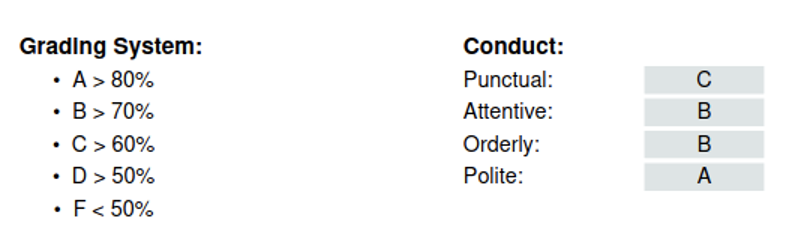
Grading Scheme and Conduct Column
The rest of the report consists of the grading scheme and the conduct which was again generated using the tables and formatted using the cell Style struct that we defined earlier. The Grading scheme is a one column table that displays how grades were assigned and the conduct is a two column table to define conduct for each student. The alignment of these tables was done with a 12-column alignment grid table where the grade and conduct tables were placed at column column 1 and 8 respectively, spawning 3 and 5 columns each.
// 12-column table for alignment (grid).
grid := c.NewTable(12)
grid.SetMargins(0, 0, 50, 0)

gradeInfoStyle := c.NewTextStyle()
gradeInfoStyle.Font = font
gradeInfoStyle.FontSize = 15

// Grading system table.
table = c.NewTable(1)
drawCell(table, newPara(c, "Grading System:", boldStyle), cellStyles["gradingsys-head"])
drawCell(table, newPara(c, "\u2022 A > 80%", gradeInfoStyle), cellStyles["gradingsys-row"])
drawCell(table, newPara(c, "\u2022 B > 70%", gradeInfoStyle), cellStyles["gradingsys-row"])
drawCell(table, newPara(c, "\u2022 C > 60%", gradeInfoStyle), cellStyles["gradingsys-row"])
drawCell(table, newPara(c, "\u2022 D > 50%", gradeInfoStyle), cellStyles["gradingsys-row"])
drawCell(table, newPara(c, "\u2022 F < 50%", gradeInfoStyle), cellStyles["gradingsys-row"])

grid.MultiColCell(3).SetContent(table)
grid.SkipCells(4)

// Conduct table.
table = c.NewTable(2)
table.SetColumnWidths(0.6, 0.4)
drawCell(table, newPara(c, "Conduct:", boldStyle), cellStyles["conduct-head"])
table.SkipCells(1)
drawCell(table, newPara(c, "Punctual:", gradeInfoStyle), cellStyles["conduct-key"])
drawCell(table, newPara(c, string(card.Punctual), gradeInfoStyle), cellStyles["conduct-val"])
drawCell(table, newPara(c, "Attentive:", gradeInfoStyle), cellStyles["conduct-key"])
drawCell(table, newPara(c, string(card.Attentive), gradeInfoStyle), cellStyles["conduct-val"])
drawCell(table, newPara(c, "Orderly:", gradeInfoStyle), cellStyles["conduct-key"])
drawCell(table, newPara(c, string(card.Orderly), gradeInfoStyle), cellStyles["conduct-val"])
drawCell(table, newPara(c, "Polite:", gradeInfoStyle), cellStyles["conduct-key"])
drawCell(table, newPara(c, string(card.Polite), gradeInfoStyle), cellStyles["conduct-val"])

grid.MultiColCell(5).SetContent(table)

c.Draw(grid)
Generating the PDF output file
In the end the PDF can be generated by using the WriteToFile function which was used in the generateReports function.
// Write to output file.
if err := c.WriteToFile(card.Name + "\_marksheet.pdf"); err != nil {
log.Fatal(err)
}
The whole function
func generateReports(font, fontBold \*model.PdfFont, cards []studentReportCard) error {
for _, card := range cards {
// Creating Reports
c := creator.New()
c.SetPageMargins(40, 40, 0, 0)

// Filled rectangle on top.
rect := c.NewRectangle(0, 0, creator.PageSizeLetter[0], 120)
rect.SetFillColor(creator.ColorRGBFromHex("#dde4e5"))
rect.SetBorderWidth(0)
c.Draw(rect)

headerStyle := c.NewTextStyle()
headerStyle.FontSize = 50

// Table with 1 column to center the text.
table := c.NewTable(1)
table.SetMargins(0, 0, 20, 0)
drawCell(table, newPara(c, "Report Card", headerStyle), cellStyles["centered"])
c.Draw(table)

// Double line.
line := c.NewLine(0, 120, creator.PageSizeLetter[0], 120)
line.SetLineWidth(5)
c.Draw(line)

line = c.NewLine(0, 123, creator.PageSizeLetter[0], 123)
line.SetLineWidth(1.5)
c.Draw(line)

// writing Marks
writeMarks(c, font, fontBold, card)

// Line on bottom.
line = c.NewLine(0, creator.PageSizeLetter[1]-3, creator.PageSizeLetter[0], creator.PageSizeLetter[1]-3)
line.SetLineWidth(5)
c.Draw(line)

line = c.NewLine(0, creator.PageSizeLetter[1], creator.PageSizeLetter[0], creator.PageSizeLetter[1])
line.SetLineWidth(1.5)
c.Draw(line)

// Write to output file.
if err := c.WriteToFile(card.Name + "\_marksheet.pdf"); err != nil {
log.Fatal(err)
}
}
return nil
}
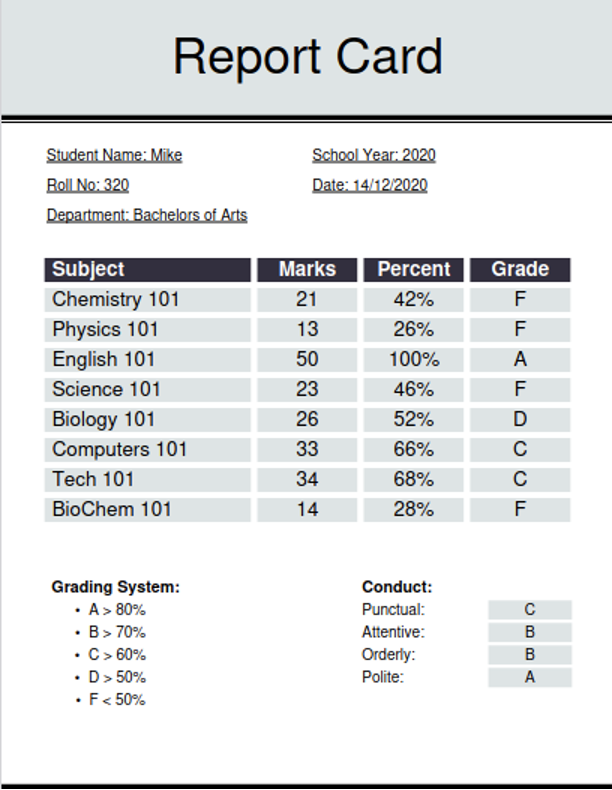
Final Report
The final Report after drawing all the tables and adding the relevant information looks as follows
Performance
Lastly, we want to check the performance of our report generation.
We add to the beginning of our code
func main() {
start := time.Now()
and at the end of the main function
end := time.Now()
fmt.Printf("diff: %v\n", end.Sub(start))
}
This gives us the total time for generating all the 5 reports for 5 students. The result we get is
diff: 36.193497ms
So around 36.2ms, or 7.2ms. This means in one second, we could generate hundreds of reports, or in a web system we could serve PDF reports in real-time with a click of a button.
Conclusion
UniPDF can be used to generate professional reports with little effort and easy to learn with superb performance. There are many things that can be done in this way like generating Financial Reports, Public data, Medical Health Records, UniPDF can provide the base for generating a lot of reports in a little time.