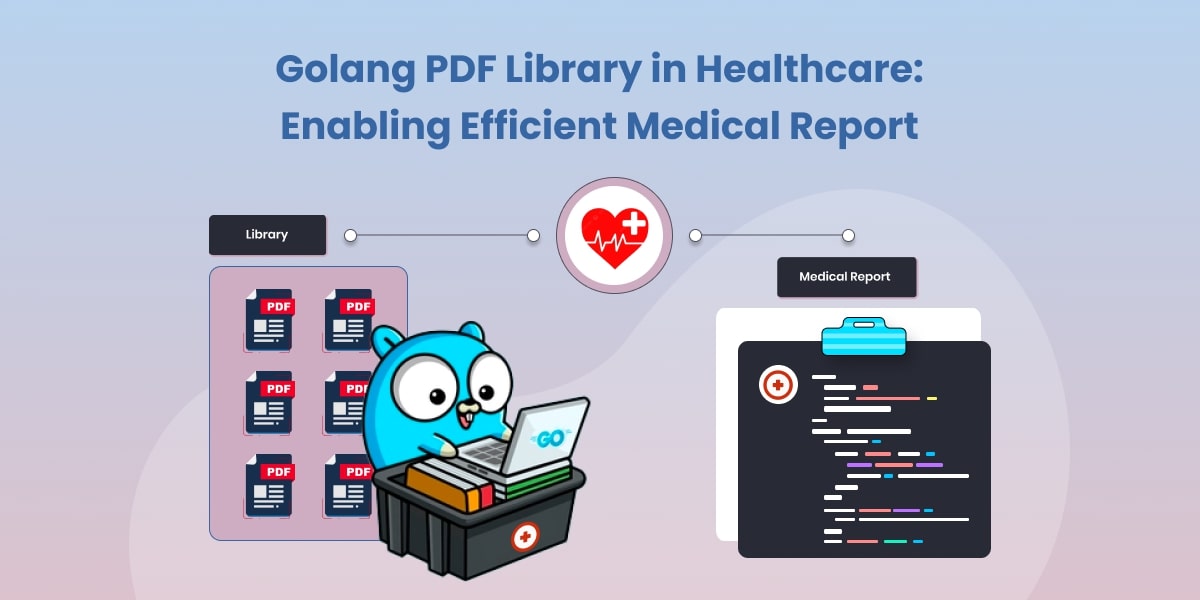
Generating PDF Reports with Golang: Best Practices for Data Visualization

Introduction
In today’s data-driven world, presenting information in a visually appealing and comprehensive manner is crucial for effective communication.
Generating PDF reports with Golang provides developers with a powerful tool set to create stunning data visualizations that convey insights clearly and concisely.
In this blog post, we’ll delve into the best practices for data visualization using Golang, enabling you to craft impressive PDF reports that captivate your audience.
Why Choose Golang for PDF Report Generation?
Golang, also known as Go, is a modern programming language designed for efficiency and ease of use. Its simplicity, strong concurrency support, and performance make it an excellent choice for generating PDF reports. By leveraging Golang’s capabilities, developers can seamlessly integrate data processing, visualization, and report generation into a unified workflow.
Best Practices for Data Visualization in PDF Reports
Choose the Right Visualization Libraries
Selecting the appropriate visualization libraries lays the foundation for crafting compelling PDF reports. Golang offers various libraries, such as UniPDF, gg and Draw 2d, that facilitate the creation of charts, graphs, and other visual elements. Assess your project’s requirements and opt for libraries that provide the desired level of customization and interactivity.
Design for Clarity and Simplicity
When designing data visualizations, prioritize clarity and simplicity. Complex visuals can confuse readers and dilute the message you’re trying to convey. Choose clean layouts, clear labeling, and intuitive color schemes to enhance comprehension. Ensure that your visualizations accurately represent the data and avoid distorting information for the sake of aesthetics.
Incorporate Interactive Elements
Engage your readers by incorporating interactive elements within your PDF reports. Golang’s concurrency features enable you to create interactive charts and graphs that users can manipulate to explore data dynamically. Interactivity enhances user engagement and empowers them to uncover insights tailored to their interests.
Optimize Performance
Efficient code is essential for generating PDF reports quickly and maintaining a seamless user experience. Profile your code to identify bottlenecks and optimize resource-intensive operations. Utilize Golang’s built-in concurrency support to parallelize tasks and maximize processing efficiency.
Ensure Cross-Platform Compatibility
To reach a wide audience, ensure that your PDF reports are compatible across different platforms and devices. Test your reports on various operating systems and screen sizes to guarantee consistent rendering and legibility. Golang’s portability makes it easier to create reports that look and function seamlessly on diverse platforms.
Leverage Data Visualization Principles
Adhering to established data visualization principles will elevate the quality of your PDF reports. Consider aspects like choosing appropriate chart types, emphasizing data comparisons, and providing context through annotations and captions. By following these principles, you can create visualizations that effectively convey insights and tell a compelling data-driven story.
Conclusion
Generating PDF reports with Golang opens up a world of possibilities for creating impactful data visualizations. By adhering to best practices in data visualization, you can craft reports that engage, inform, and inspire your audience. If you’re looking for a comprehensive guide, check out this blog on creating PDF reports in Golang.
Golang’s versatility and performance ensure that your PDF reports not only look impressive but also provide a seamless user experience. As you embark on your journey to create stunning PDF reports, keep these best practices in mind to unlock the full potential of data visualization with Golang.